As the industry continues to evolve and face external factors, brands need to be smarter than ever with their decisions in order to maximise opportunities. Do you know which of your products you’re selling the most of and where? Can you identify your gaps for growth and areas of market share? With the right data you can!
With Pinpoint, the focus is on helping brands to take action faster in the Convenience sector by using data. The Thumbprint team make it their mission to deliver fast and simple insight. One way to do that is by improving the way brands access and manage their data. A faster route to data means faster decisions and less profit lost on missed sales opportunities.
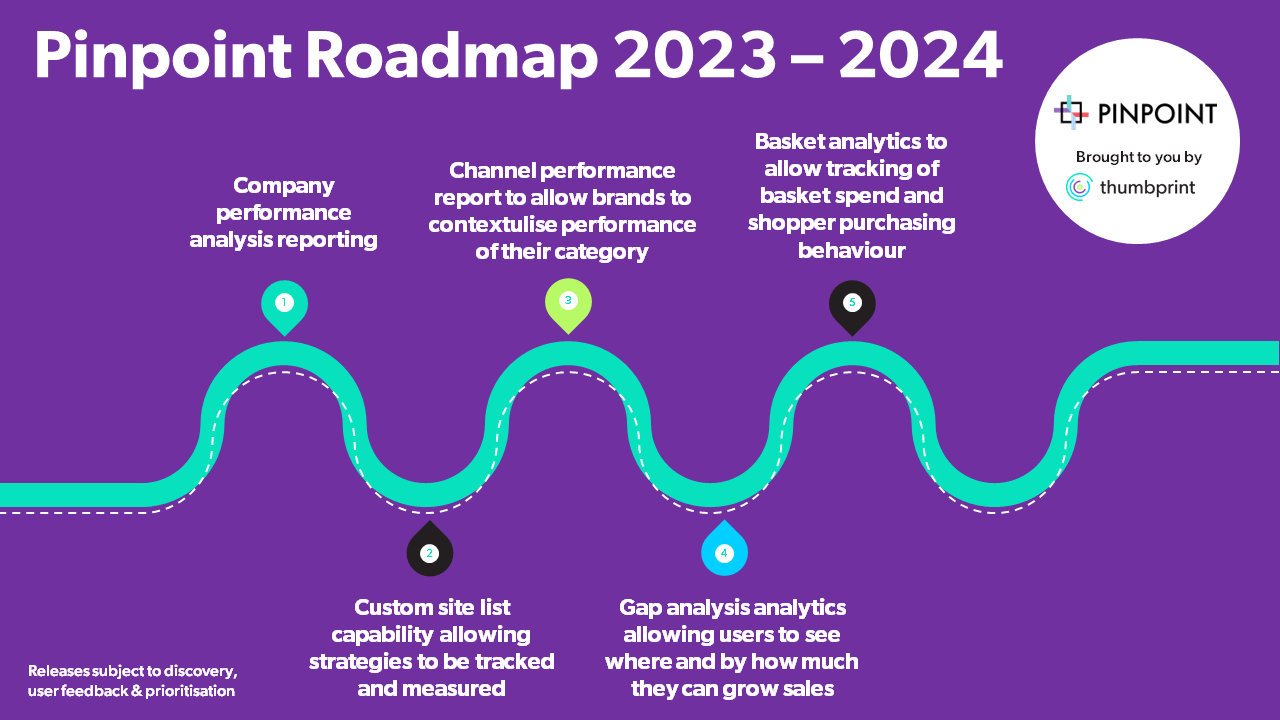
With several exciting new product feature releases already rolled out this year, there are still many more to come on our journey to make insight to action as quick and easy as possible for brands. Want a sneak peek of what lies ahead as part of our Pinpoint Roadmap for success?
Read on to discover 5 Pinpoint releases that could help you manage your data better and boost your Convenience sales performance…
Get a tailored view of your brand’s overall performance
1. Brand Report
The latest Pinpoint development is a new dashboard that allows users to interrogate any brand within the category to obtain actionable insight more easily.
The Brand Report feature enables users to identify:
- The performance of a brand overall or in any of its categories.
- What products are driving performance in a ranked view.
- Where growth or market share is coming from, or where it’s declining geographically - at country, regional, postcode and fascia level.
- The brand distribution and growth of distribution across configurable country, national, regional, postcode, fascia and symbol group level.
- Key category insights on top performing brands within the category, and where the category is performing the strongest.
View a breakdown of your company sales
2. Company level reporting
Unsure how your business is actually performing in Convenience? This new report gives you a dashboard view of your company performance, allowing you to quickly identify if you’re winning or losing within the channel.
This enables users to identify:
- How much each sector of the Convenience channel contributes towards your sales (Symbols vs Independent stores).
- How your company is performing in terms of sales value, unit, and market share within the total channel or in Symbols or Independents.
- Visually see how your sales as a business have evolved over time.
Identify and target your gaps across the estate
3. Gap Analysis Analytics
Unsure where to focus your people and budget to get the biggest return on investment? The report lists target actions to act upon based on scale of opportunity to help brands prioritise their actions towards the ones that have the biggest monetary value.
A view on performance is currently only easily available at category level, so this enables a user a quick way to view a rolled up view of the performance of their total business.
Brands can use this data to:
- Identify where there is a cluster of product underperformance at region and fascia level.
- Know where market share or sales performance is performing poorly, which allows a distributor to take steps to fix this on a targeted approach.
- Understand LSV – see the actual value that could be gained if the gap is closed.
Assess your key performance metrics and benchmark against key stores
4. Custom Site List Evaluation Capability
Not sure where to test your next NDP or promotion before it fully goes live? A new reporting function allows users to easily measure key metrics of performance in key outlets against a reflective set of control stores.
This includes, for example, understanding where branded chiller sites exist or where brands could test POS placement and fixture enhancements.
Benchmark your performance by category
5. Channel Performance Report
Need to understand the big picture but can’t get a clear view? With Pinpoint you can. A new reporting function allows users to benchmark performance of your category against total Convenience performance and other key Convenience categories.
This helps brands to understand how the broader market is performing and how external factors impact performance.

The difference in Pinpoint vs other products is that we’re constantly investing in it. The one thing that you can guarantee if you buy Pinpoint is you are going to get a continuous stream of development releases that help you achieve results – and you have a voice in what that development is.
Hear from Gordon Neil, our Thumbprint Managing Director on how brands help shape our products:
“Our Thumbprint products are always developed with users in mind. They’re the ones who need to get to the insight and direction Pinpoint and DART provide as quickly as possible. They’re also the ones whose needs change as the industry, and brand strategy evolves.
For this reason, our users have a strong voice in the development roadmaps for our products. We listen and understand their use cases and stories to build and implement a roadmap that helps them unlock more value in their role, every day.
In the volatile FMCG industry that we face into, needs can change. So, we adopt an agile approach to our development roadmap - enabling us to reprioritise where required as the industry evolves.
User feedback has shaped the roadmaps we have for the remainder of 2023 and into 2024 for Pinpoint and DART, and we can’t wait to deliver even more value for our clients as we release those developments.”
Continuous improvement is happening all the time - follow our LinkedIn page keep up to date with product & service developments and releases.


